Power BI Dashboards
Tap any dashboard to inspect the visualization details.
View Dashboard
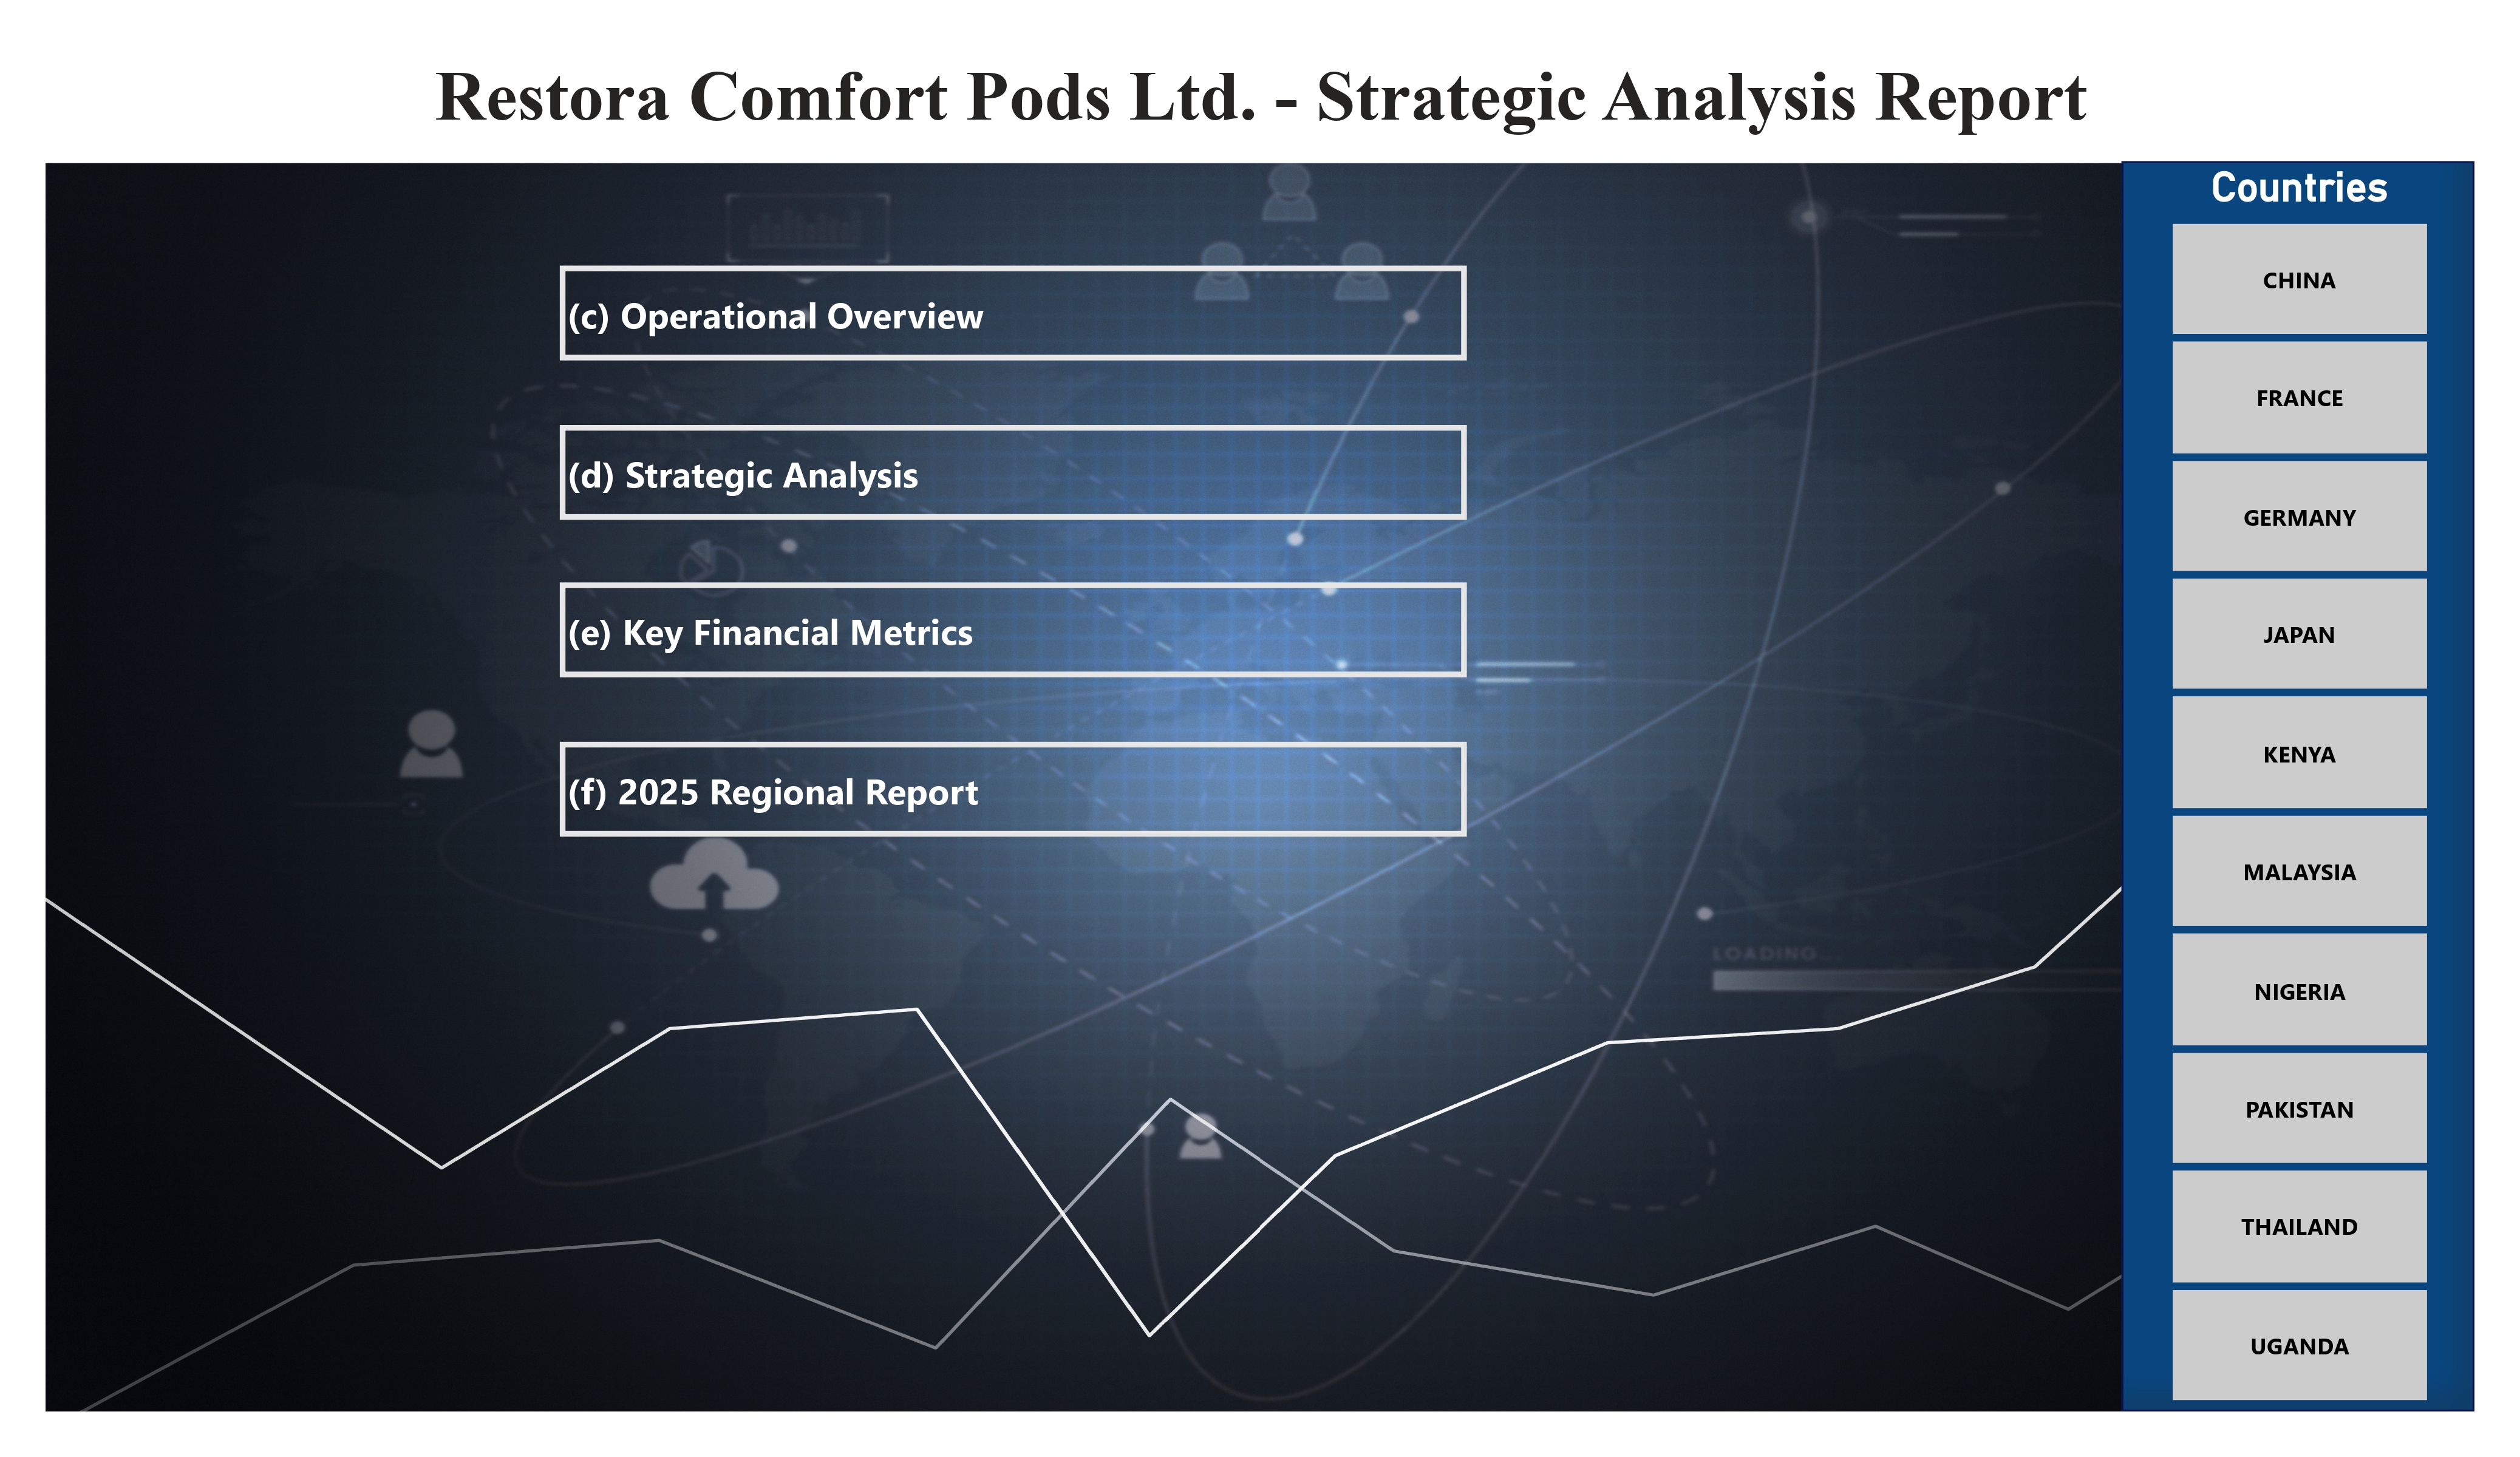
Title page
View Dashboard
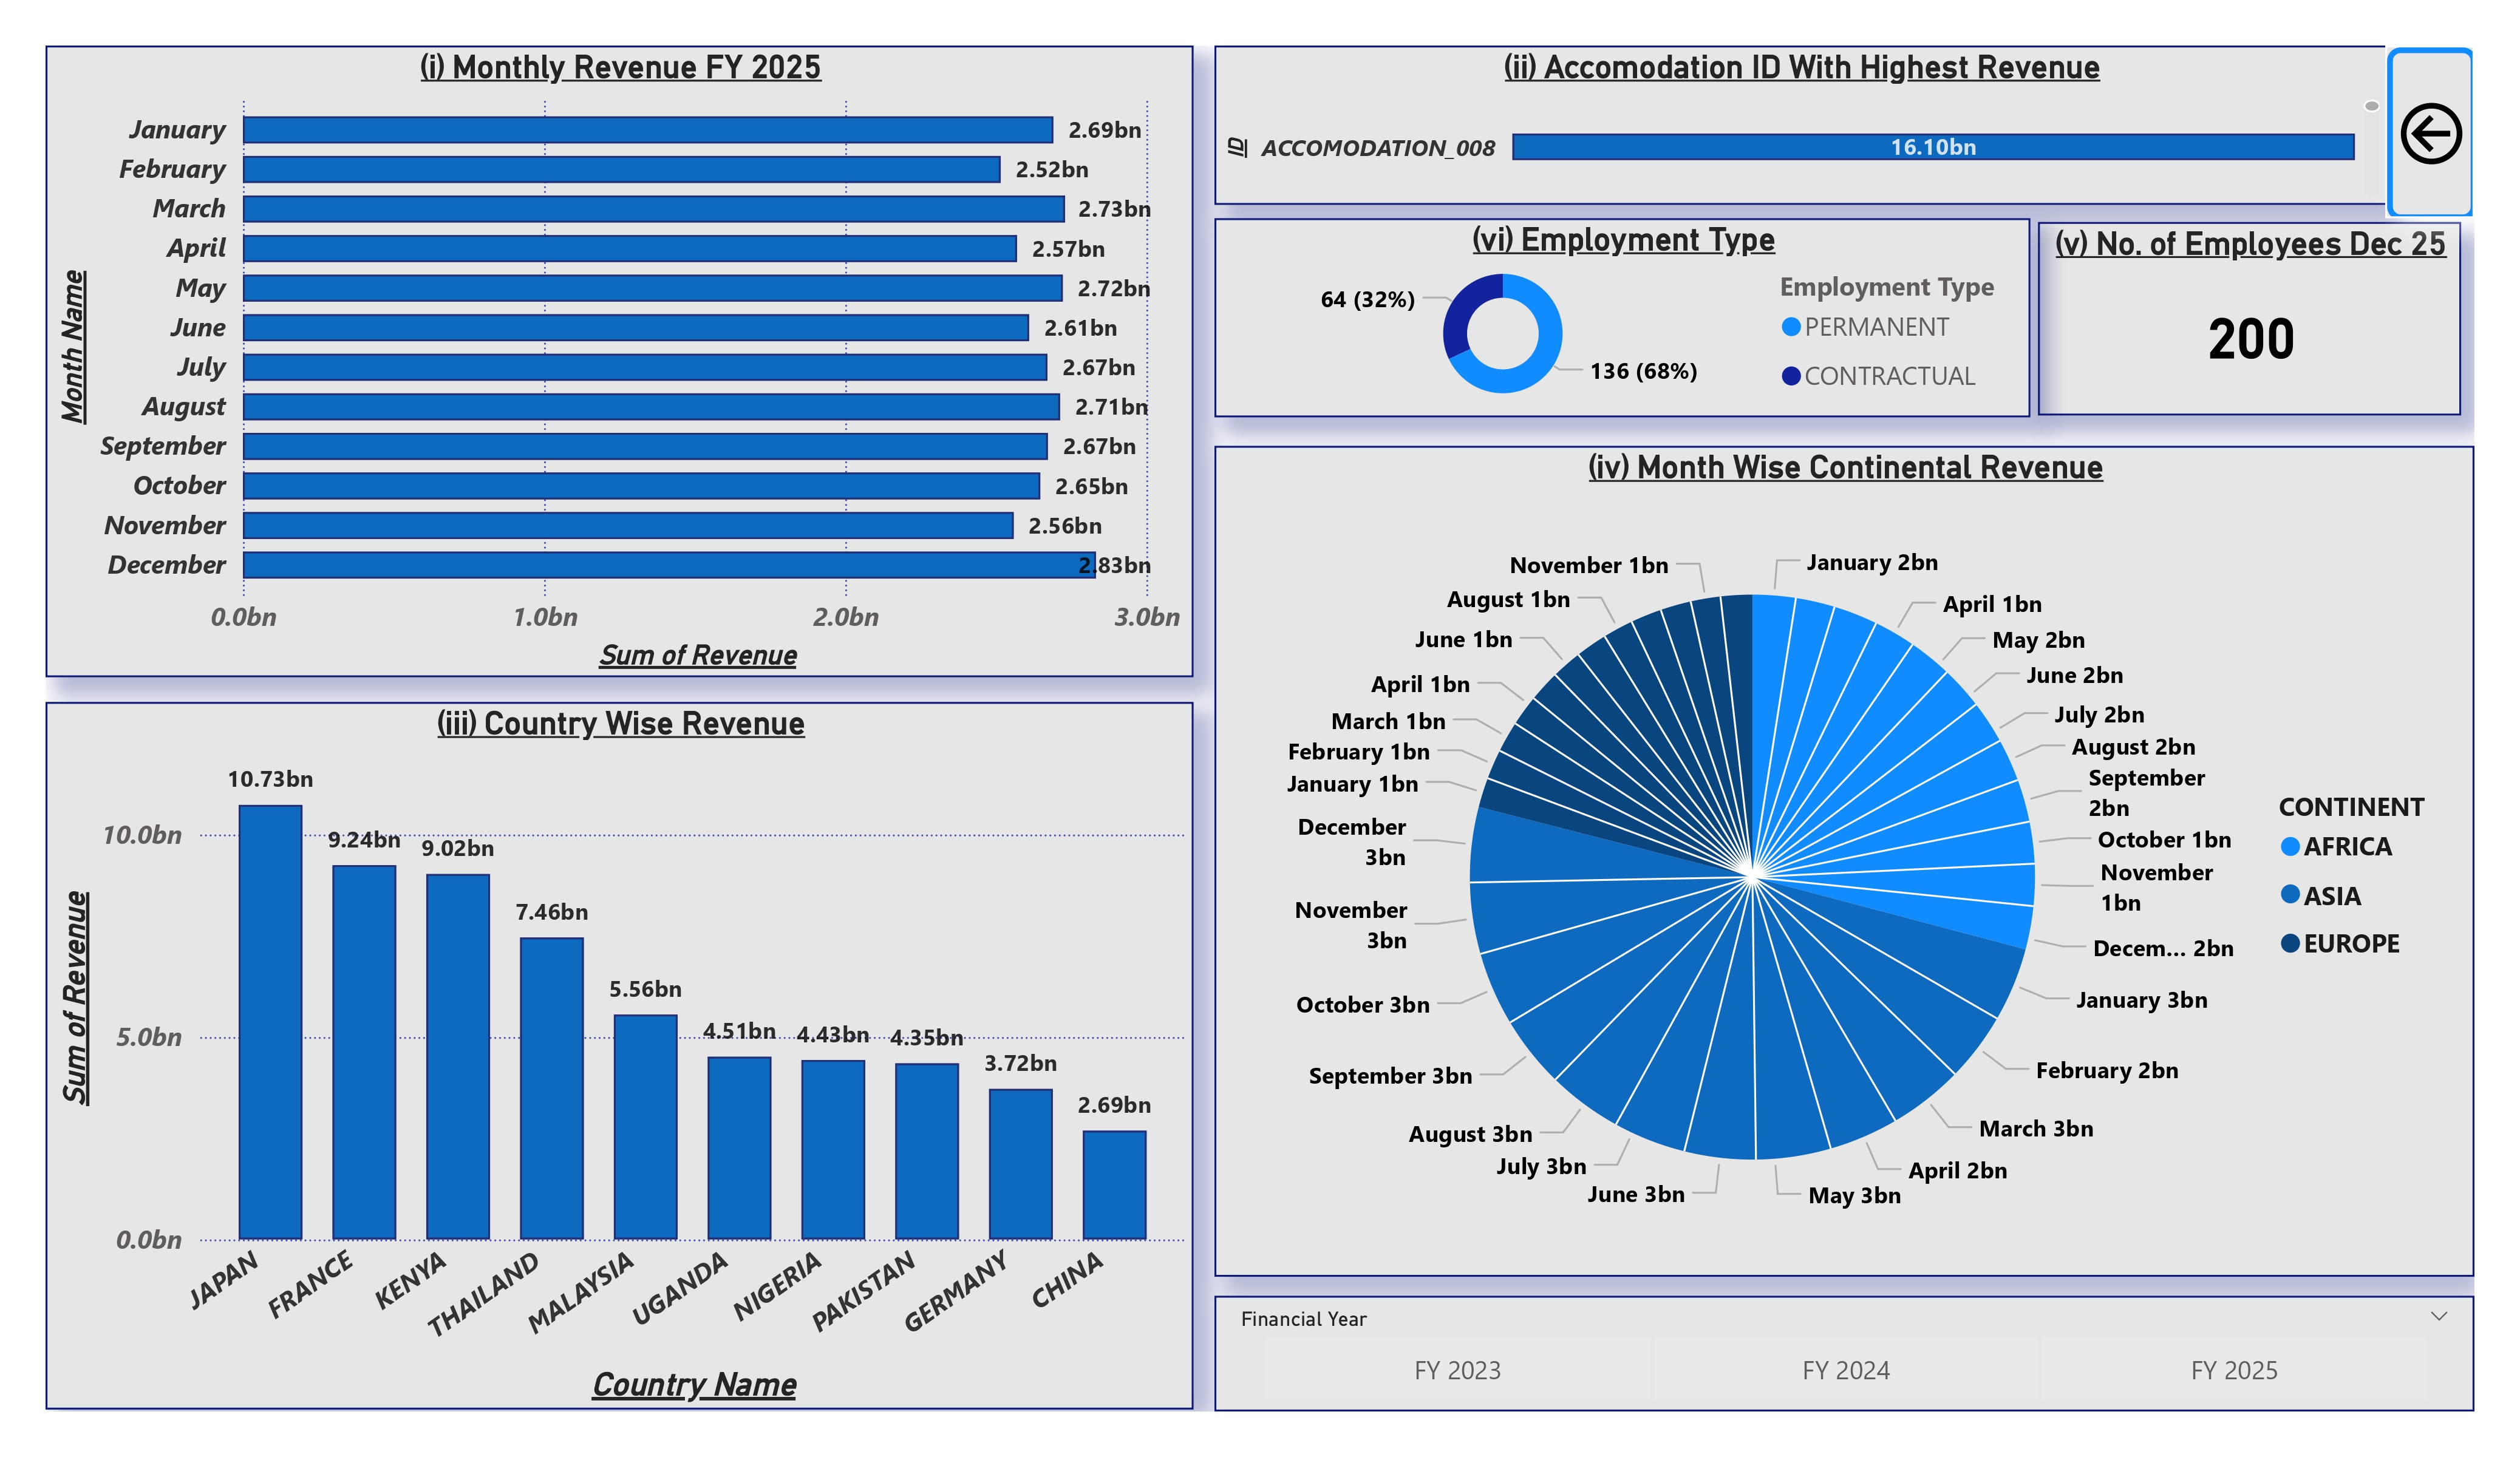
Operational Overview
View Dashboard
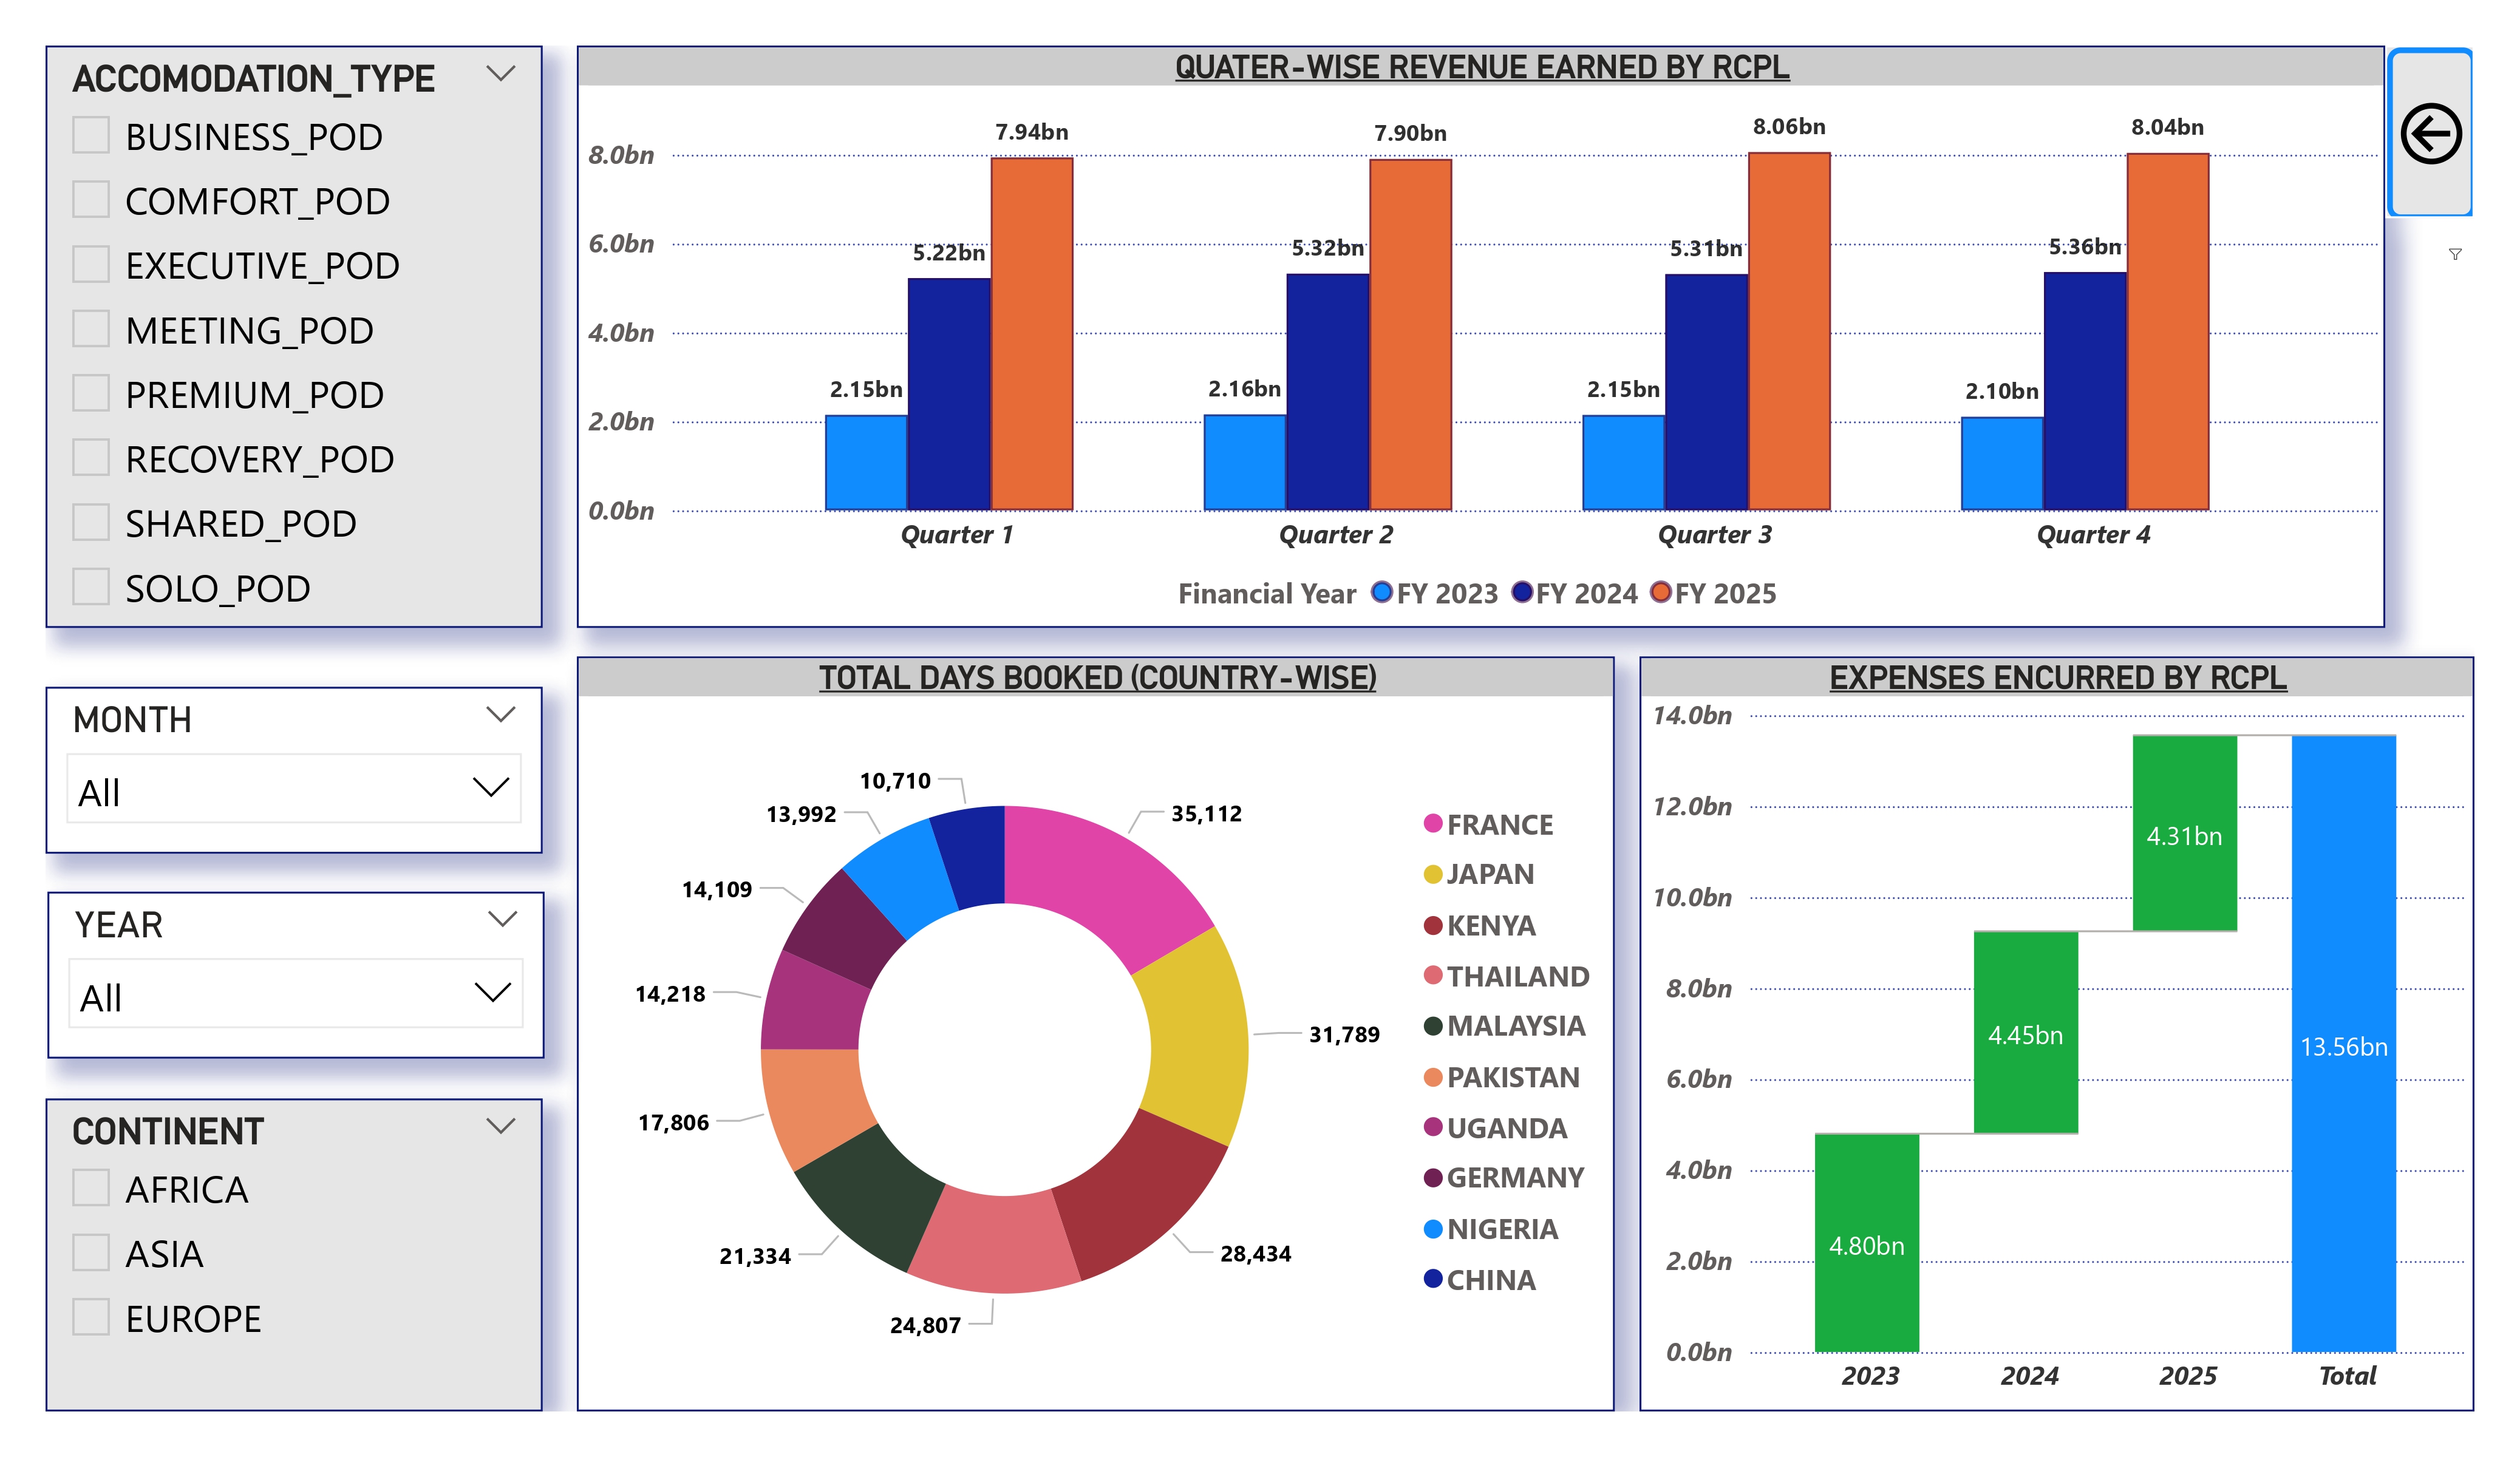
Strategic Analysis
View Dashboard
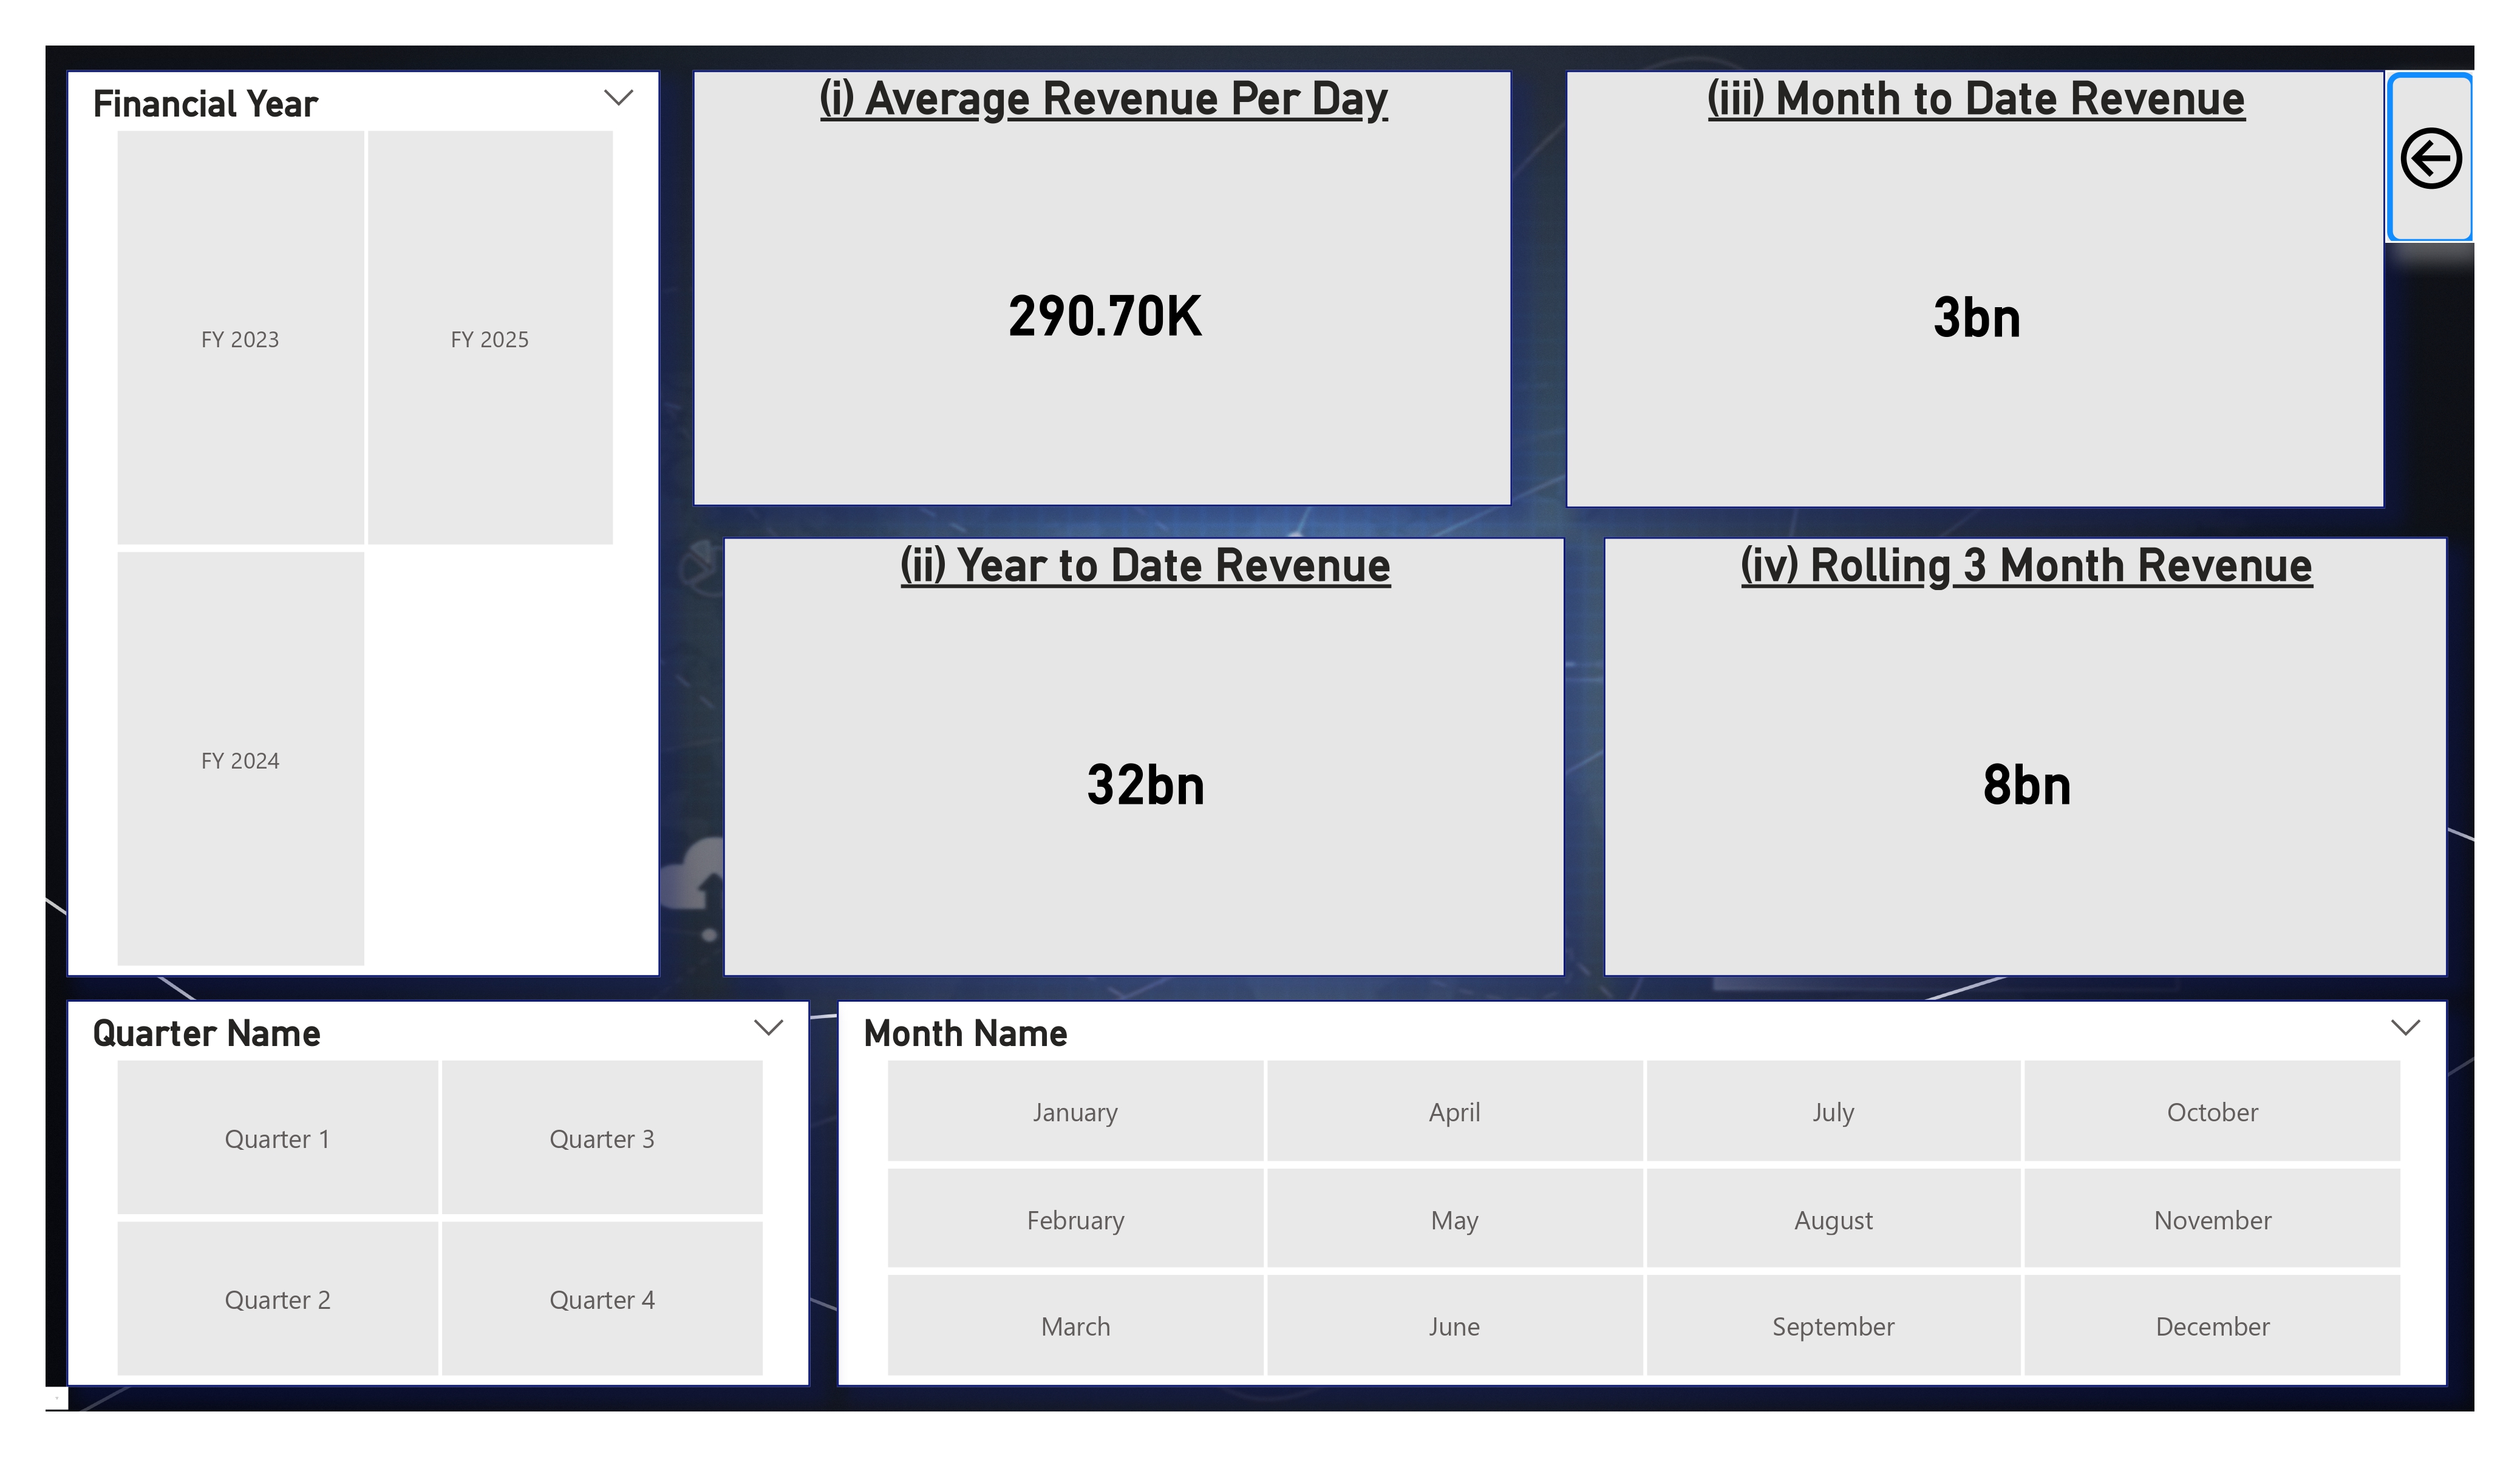
KPIs
View Full Size
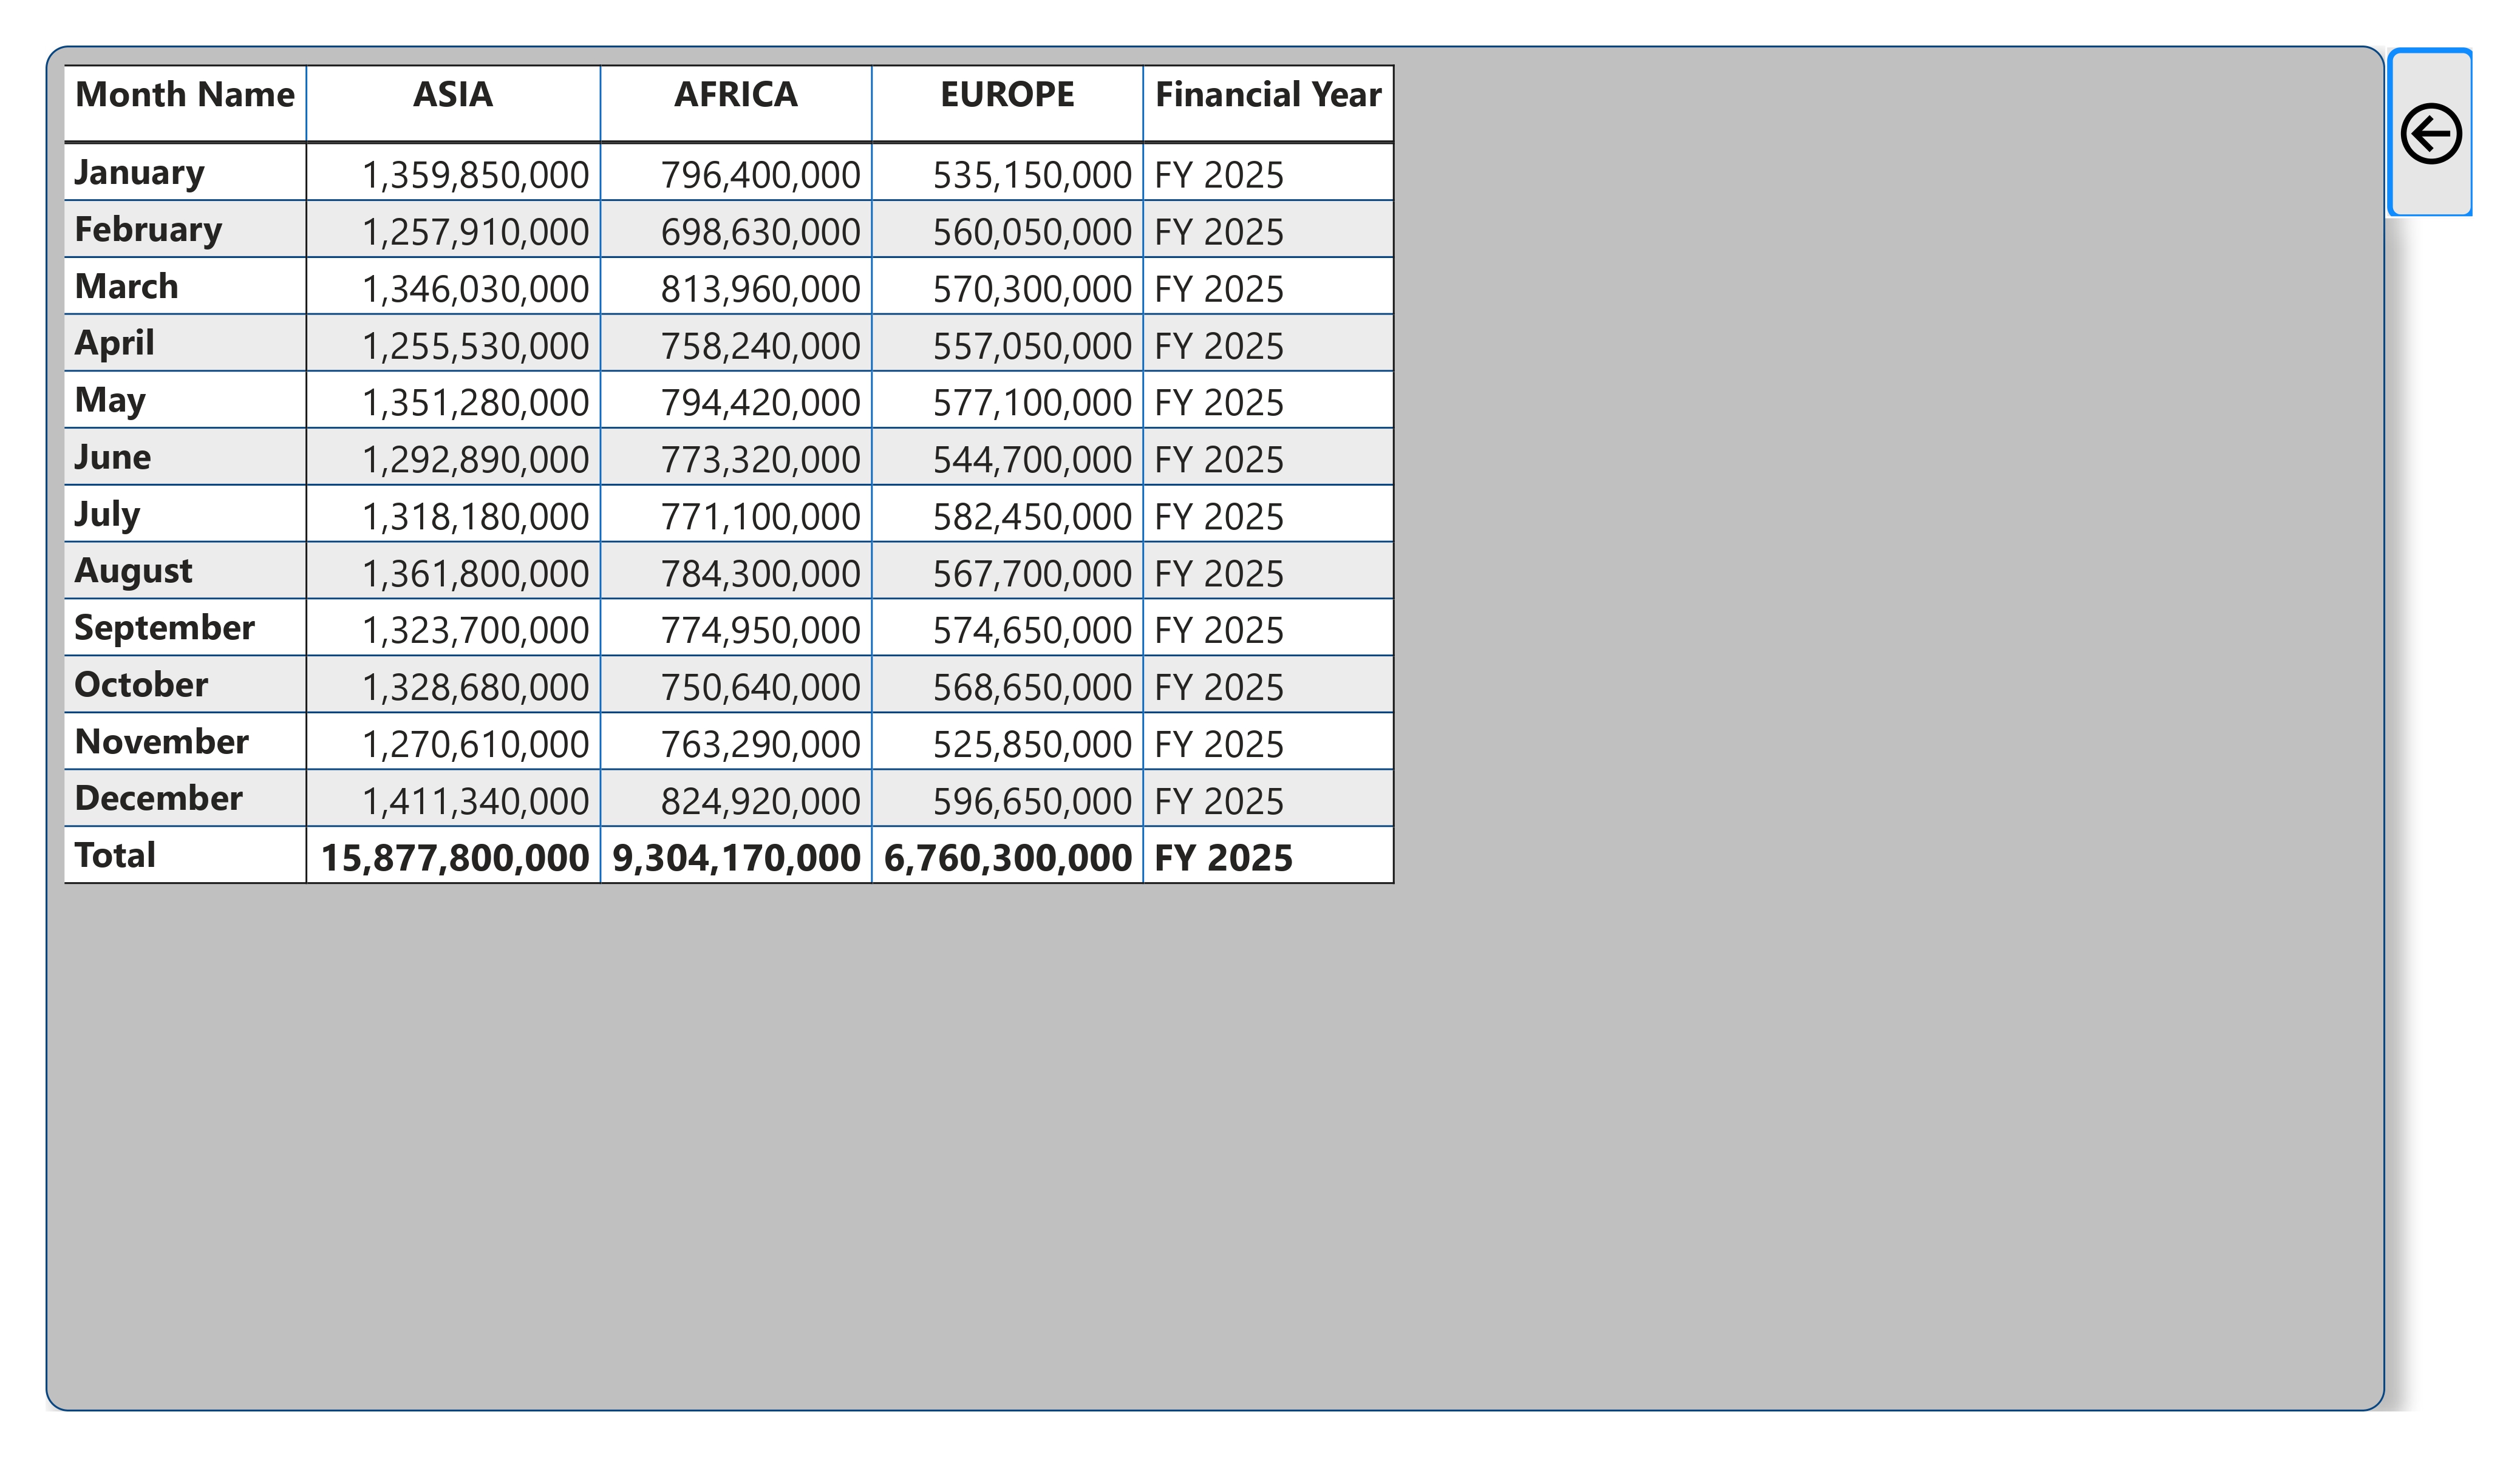
2025 Regional Report